WPCode
93Easily add code snippets in WordPress. Insert header & footer scripts, add PHP code snippets with conditio...
Free
3M+ installs 4.9★ (1,873)
Query Monitor is the developer tools panel for WordPress and WooCommerce.
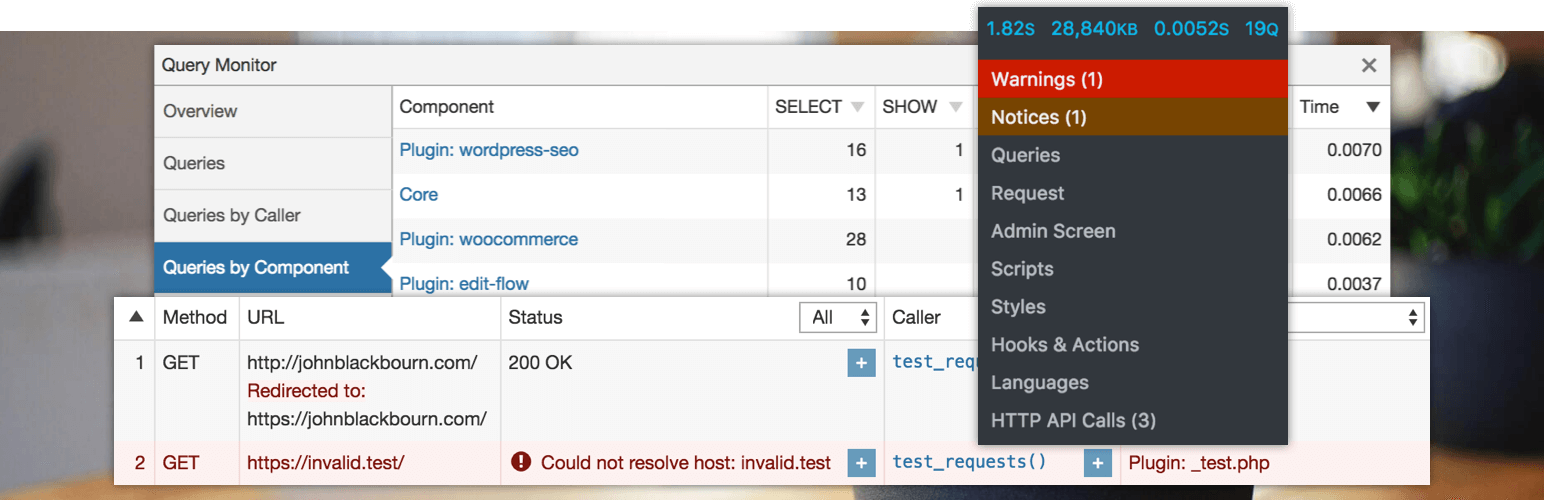
Query Monitor is a WordPress plugin designed for developers to assist in debugging various aspects of WordPress and WooCommerce sites. It provides detailed insights into database queries, PHP errors, and other performance metrics, allowing you to identify issues related to plugins, themes, and functions. The plugin presents information in an organised manner, making it easier to pinpoint poorly performing components.
With features like Ajax and REST API call debugging, user capability checks, and an overview of template usage, Query Monitor is particularly useful for developers looking to optimise their sites. It is suitable for those who need to troubleshoot and enhance the performance of their WordPress installations.
Best for: This plugin is best for developers and site administrators who need to debug and optimise WordPress sites.
What it does well
Where it falls short
Query Monitor is a comprehensive tool for debugging in WordPress, offering a wealth of information for developers. It is particularly valuable for those focused on performance and troubleshooting.
John Blackbourn's own description of Query Monitor, lightly tidied.
Query Monitor is the developer tools panel for WordPress and WooCommerce. It enables debugging of database queries, PHP errors, hooks and actions, block editor blocks, enqueued scripts and stylesheets, HTTP API calls, and more.
It includes some advanced features such as debugging of Ajax calls, REST API calls, user capability checks, and full support for block themes and full site editing. It includes the ability to narrow down much of its output by plugin or theme, allowing you to quickly determine poorly performing plugins, themes, or functions.
Query Monitor focuses heavily on presenting its information in a useful manner, for example by showing aggregate database queries grouped by the plugins, themes, or functions that are responsible for them. It adds an admin toolbar menu showing an overview of the current page, with complete debugging information shown in panels once you select a menu item.
Query Monitor supports versions of WordPress up to three years old, and PHP version 7.4 or higher.
For complete information, please see the Query Monitor website.
Here’s an overview of what’s shown for each page load:
SELECT, UPDATE, DELETE, etc), responsible component (plugin, theme, WordPress core), and calling function, and provides separate aggregate views for each.is_single(), is_home(), etc.switch_to_blog() and restore_current_blog() on Multisite installations.In addition:
qm property of the response.By default, Query Monitor’s output is only shown to Administrators on single-site installations, and Super Admins on Multisite installations.
In addition to this, you can set an authentication cookie which allows you to view Query Monitor output when you’re not logged in (or if you’re logged in as a non-Administrator). See the Settings panel for details.
Query Monitor is also available as an optional browser dev tools extension. This is an alternative to using the in-page panel that gets output into the admin toolbar.
Using the browser extension has some advantages over the in-page panel:
Information about the Query Monitor browser extension can be found here.
Other plugins for developer tooling.
Easily add code snippets in WordPress. Insert header & footer scripts, add PHP code snippets with conditio...

Easily add tracking code snippets, conversion pixels, or other scripts required by third party services for an...
Duplicate post, post order, image resize, email via SMTP, admin menu editor, custom css / code, disable gutenb...

Create custom "Shortcodes" easily for HTML, JavaScript, CSS code snippets and use the shortcodes wit...
Add PHP code to your pages and posts easily using shortcodes.
An easy, clean, and simple way to enhance your site with code snippets.