SureRank SEO
90Lightweight SEO assistant for meta tags, schema and structured data, XML sitemaps, Open Graph previews, robots...
Free
400k+ installs 4.8★ (41)
Create responsive charts and tables manually or let the built-in AI build them from a text prompt. Supports multiple chart types and flexible data.
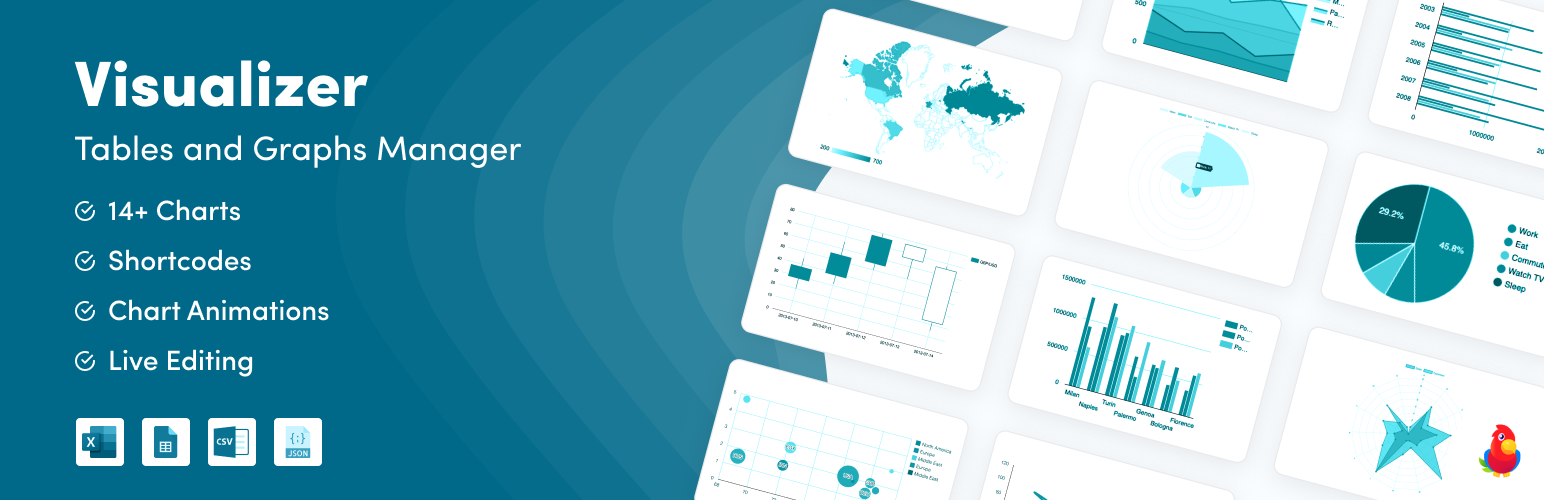
Visualizer is a WordPress plugin designed for creating, managing, and embedding interactive charts and tables within your posts and pages. It uses the Google Visualization API, DataTables.net, and ChartJS libraries to ensure responsive and animated data displays that work well across devices.
The plugin features an AI chart builder that generates charts from simple text descriptions, making it accessible for users without technical expertise. It is suitable for bloggers, educators, and small business owners looking to enhance their content with visual data representations.
Best for: This plugin is ideal for bloggers, educators, and small business owners who need to present data visually.
What it does well
Where it falls short
Visualizer offers a straightforward solution for embedding charts and tables in WordPress. Its AI capabilities and responsive design make it a practical choice for users looking to enhance their content with minimal effort.
Themeisle's own description of Visualizer, lightly tidied.
Visualizer: Tables and Charts Manager for WordPress is a powerful and easy to use plugin used to create, manage and embed interactive, responsive charts & tables into your WordPress posts and pages.
The plugin leverages the Google Visualization API, DataTables.net, and ChartJS libraries to deliver responsive and animated charts, graphs, and tables, ensuring excellent cross-browser compatibility and a seamless mobile experience. It also comes with a built-in AI chart builder powered by D3.js that turns a plain text description into a publish-ready chart in seconds, no setup required. You can fully customize all aspects of the charts and tables to suit your needs. For enhanced data management features, including importing from Excel, CSV, Google Sheets, and more, consider exploring the PRO version.
AI-Powered Chart Generation: Describe the chart you need in plain everyday language, and Visualizer AI builds it for you instantly. No API key, no setup, and no technical knowledge required. Whether you are a blogger, educator, or small business owner, you can go from a simple text prompt to a fully customizable, ready-to-embed chart in seconds, completely free.
Diverse Chart Options: Begin with essential chart types like line, pie, bar, and table in the free version. Elevate your data presentation with advanced chart types such as scatter, area, and geo available in the Pro version. The free version offers a comprehensive range of options that are perfect for various visualization needs.
Manual Data Entry: Input data manually for quick visualization tasks. This method provides ultimate control over the content and structure of your charts, making it simple to tailor data presentation directly within the plugin interface.
Ultimate Responsiveness: Crafted using HTML5/SVG technology, Visualizer charts ensure flawless functionality across all devices. This commitment to responsiveness guarantees that your data is not only accessible but also optimally displayed on desktops, tablets, and smartphones, enhancing user interaction and engagement.
Data Table Capabilities: In addition to our responsive charts and graphs, you can also add responsive tables to your posts and pages and customize them to your liking. Visualizer Pro lets you enhance them with features such as sorting capabilities, pagination, and search functions. From pricing tables to product tables, the possibilities are vast and customizable to meet any data presentation need.
Seamless Integration and Compatibility: Whether you’re using the Gutenberg editor or other page builders, Visualizer integrates effortlessly into your WordPress environment. This seamless compatibility allows for straightforward chart insertion and management.
Flexible and Customizable: Make the charts and tables truly your own. Visualizer offers an extensive set of configuration options to perfectly match the look and feel of your website. Utilize Google Chart Tools with their default settings for simplicity, or dive into customization if your site’s style requires a unique approach. Every chart and table exposes numerous options that customize its appearance and functionality, ensuring your visualizations integrate seamlessly into your pages.
These versatile data handling capabilities ensure that Visualizer Free is equipped to meet a wide range of data visualization requirements right out of the box. Perfect for bloggers, educators, small businesses, and more, Visualizer helps you turn raw data into compelling, interactive charts that engage and inform your audience.
The above descriptions were partially taken from the Google Visualization API site
Chart creation has always been the most time-consuming part of working with data. Picking the right chart type, entering values manually, and tweaking settings until it looks right. Visualizer AI changes that entirely.
Just describe what you want, and Visualizer builds it for you. Preview it live, refine it with follow-up prompts, and publish when it looks right. No coding, no configuration, and no API key required. It is available to all users, completely free, the moment you activate the plugin.
Here is what you can do with it:
📊 Turn a sales spreadsheet into a chart in seconds. Upload your data, type something like “create a bar chart showing monthly revenue by region,” and watch Visualizer build it live.
📋 Visualize survey results without the manual work. Got a CSV of responses? Upload it, describe the breakdown you want to see, and let AI handle the rest.
🎨 Match your brand without touching the settings. Mention your brand colors in your prompt, and Visualizer styles the chart accordingly, no manual color picking needed.
🖼️ Build from a reference image. See a chart style you like somewhere? Upload it as a reference, and Visualizer will use it as inspiration with your own data.
You Own a Personal or Small Business Website: You need a straightforward, powerful tool to enhance your website’s visual appeal with interactive charts and tables. Visualizer makes complex data understandable and engaging.
You Run an Educational or Financial Institution: For organizations that require regular reporting and data display, Visualizer offers comprehensive options for creating dynamic and informative charts and tables. This helps in better data analysis and presentation, aiding in decision-making and reporting.
You Aim to Enhance SEO and User Engagement: Using Visualizer’s interactive and responsive charts can significantly improve user engagement, keeping visitors on your site longer, which can positively impact your SEO rankings.
You are a Non-Profit Organizations: Non-profits can use Visualizer to display the impact of their initiatives through data. Create pie charts to show the distribution of spending or line charts to track donation trends over time, which can be powerful visuals for fundraising campaigns and annual reports.
You are Financial Advisors and Economists: Visualizer allows for detailed financial reporting and economic analyses with advanced chart types like candlestick and radar charts. These tools can be used to depict stock performances, economic cycles, or budget allocations, providing clients with clear insights into financial matters.
Regardless of Industry: With over 30,000 happy active users and 160+ 5-star ratings, Visualizer has been employed across a broad range of industries, including healthcare, marketing, education, and finance, demonstrating its versatility and effectiveness in any field.
Types of charts you can create with Visualizer: Visualizer WordPress graph and charts plugin provides a variety of charts that are optimized to address your WordPress data visualization needs. In the free version, it has line charts, bar charts, pie charts, table charts. These charts are based on pure HTML5/SVG technology (adopting VML for old IE versions), so no extra plugins are required. Adding these charts to your page can be done in a few simple steps.
Other plugins for charts and graphs.
Lightweight SEO assistant for meta tags, schema and structured data, XML sitemaps, Open Graph previews, robots...

Turn your data into WordPress apps with tables, forms, charts & maps — no code required, with optional hoo...

Create interactive images with clickable hotspots, using modern image maps for WordPress. Perfect for floor pl...
The best WordPress table plugin. Create responsive, and searchable tables and charts from Excel (.xlsx, .xls o...

Control how your WordPress posts, pages, WooCommerce products, and custom post types look when shared on Faceb...

The simple method to add Open Graph metadata to your entries so that they look great when shared on sites.